Melbourne rainfall by suburb, and what it means for your roof
How much rain falls where in Melbourne, from 20 Bureau of Meteorology stations near the suburbs we work in, plus heavy-rain days, hot days, cold nights and wind, and what each means for your roof.
:focal(720x150:1000x430))
)
Quick answer: Melbourne averages about 536 mm of rain a year at Melbourne Airport and 575 mm in the city (Olympic Park), but it varies a lot by suburb. Bureau of Meteorology stations record from 533 mm a year at Laverton in the west to 845 mm at Glen Waverley and 882 mm at Croydon in the east, and 1,311 mm at Ferny Creek in the Dandenong Ranges.
Ask ten Melburnians how much it rains here and you'll get ten answers, and they can all be right.
The rain gauges at Laverton and Croydon are about 48 km apart, and Croydon catches about two thirds more rain a year (882 mm against 533 mm). On a roof, that shows up as more moss, more leaf litter in the valleys and more gutter overflows the further east you go.
Less rain doesn't mean less trouble, though. The drier west and north-west get the strongest winds on record and plenty of cold nights, and that's hard on ridge caps and pointing.
Here's the data by suburb, from 20 Bureau of Meteorology stations near the areas we work in, and what it means for the roofs there.
How much rain does Melbourne get a year? About 536 mm at the Airport
Melbourne Airport averages 536.2 mm a year (BOM, 1970 to 2026), and Olympic Park in the city 575.3 mm (2013 to 2026). The wettest months at the Airport are November (62.4 mm) and October (55.7 mm); August has the most rain days (9.6).
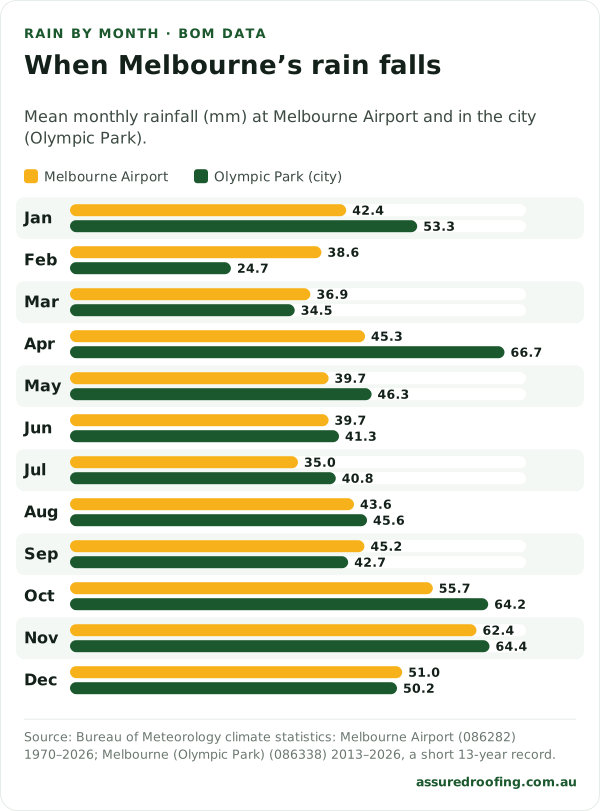
Mean monthly rainfall at Melbourne Airport and Olympic Park (BOM). The same figures are in the table below.
Month | Airport rain (mm) | Airport rain days | City rain (mm) | City rain days |
|---|---|---|---|---|
January | 42.4 | 5.0 | 53.3 | 5.4 |
February | 38.6 | 4.1 | 24.7 | 3.5 |
March | 36.9 | 5.5 | 34.5 | 5.1 |
April | 45.3 | 6.4 | 66.7 | 7.5 |
May | 39.7 | 7.5 | 46.3 | 8.5 |
June | 39.7 | 8.2 | 41.3 | 8.5 |
July | 35.0 | 8.1 | 40.8 | 9.0 |
August | 43.6 | 9.6 | 45.6 | 9.3 |
September | 45.2 | 8.9 | 42.7 | 8.2 |
October | 55.7 | 8.8 | 64.2 | 9.1 |
November | 62.4 | 7.9 | 64.4 | 7.6 |
December | 51.0 | 6.1 | 50.2 | 6.3 |
Year | 536.2 | 86.1 | 575.3 | 88.0 |
Melbourne Airport (086282), 1970 to 2026; Melbourne (Olympic Park) (086338), 2013 to 2026. Rain days are days with at least 1 mm.
Melbourne rainfall by suburb: 533 mm in the west to 882 mm in the east
Rainfall climbs as you head east towards the Dandenong Ranges. The west and north-west average 533 to 591 mm a year, the inner suburbs about 657 to 673 mm, and the south-east and outer east about 832 to 882 mm.
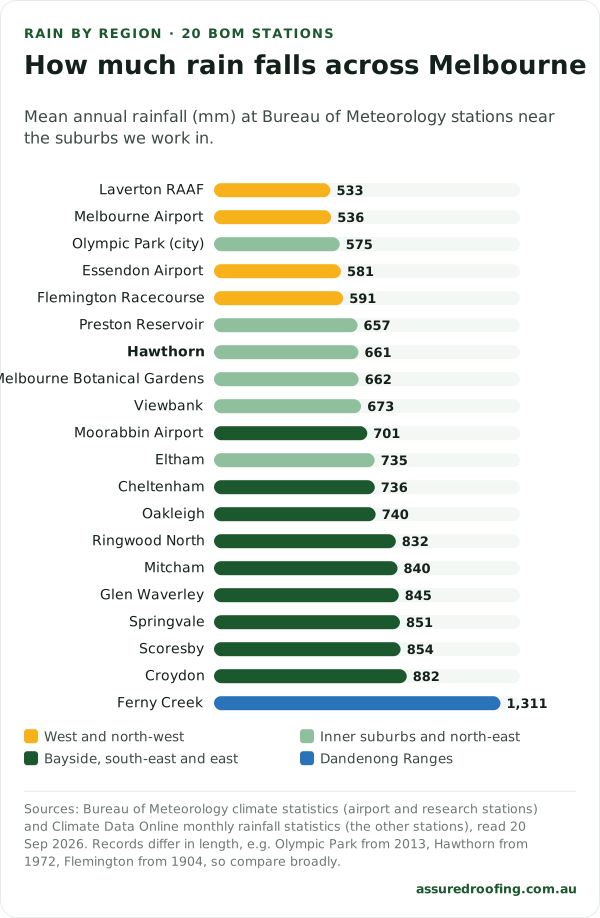
Mean annual rainfall at 20 Bureau of Meteorology stations. Each station, its record and the suburb guides nearest to it are in the table below.
BOM station | Record | Rain a year (mm) | Our suburb guides nearest to it |
|---|---|---|---|
1941 to 2026 | 532.6 | ||
1970 to 2026 | 536.2 | ||
2013 to 2026 | 575.3 | ||
1929 to 2026 | 580.9 | ||
1904 to 2026 | 591.1 | ||
1910 to 2025 | 656.9 | ||
1972 to 2026 | 660.9 | Kew, Hawthorn, Camberwell, Balwyn, Surrey Hills, Toorak, Malvern and Brighton | |
1964 to 2026 | 662.0 | none nearest | |
1999 to 2026 | 673.2 | Doncaster and Templestowe | |
1950 to 2026 | 701.4 | none nearest | |
1906 to 2026 | 735.1 | ||
1914 to 2026 | 735.8 | Hampton and Sandringham | |
1912 to 2026 | 739.6 | ||
1991 to 2026 | 832.0 | ||
1936 to 2025 | 839.9 | ||
1972 to 2026 | 845.3 | ||
1948 to 2026 | 850.9 | ||
1948 to 2026 | 853.9 | ||
1965 to 2026 | 882.0 | ||
2011 to 2026 | 1,310.8 | reference only |
The inner east sits in the middle. The BOM gauge at Scotch College in Hawthorn records 660.9 mm a year (1972 to 2026), close to Preston and the Botanical Gardens, and well short of the south-east.
Good to know "nearest" means the closest of these stations to the centre of each suburb, in a straight line. Your street can differ, especially on a hill or close to the ranges.
Which parts of Melbourne get the heaviest downpours?
The east. Scoresby averages 4.4 days a year with 25 mm of rain or more, against 2.5 at Laverton and 2.6 at Melbourne Airport. Ferny Creek in the ranges gets 10.3.
BOM station | Rain days (≥ 1 mm) | Days ≥ 10 mm | Days ≥ 25 mm | Record |
|---|---|---|---|---|
Laverton RAAF | 87.0 | 13.3 | 2.5 | 1941 to 2026 |
Melbourne Airport | 86.1 | 13.3 | 2.6 | 1970 to 2026 |
Essendon Airport | 80.7 | 13.8 | 2.5 | 1929 to 2026 |
Olympic Park (city) | 88.0 | 15.6 | 2.8 | 2013 to 2026 |
Viewbank | 95.9 | 18.3 | 3.2 | 1999 to 2026 |
Moorabbin Airport | 103.0 | 20.6 | 3.4 | 1950 to 2026 |
Scoresby | 114.6 | 25.9 | 4.4 | 1948 to 2026 |
Ferny Creek | 133.2 | 41.4 | 10.3 | 2011 to 2026 |
A 25 mm day is the test for gutters and valleys. If a gutter is blocked or a valley is full of leaves, that's the day water backs up under the tiles and into the eaves.
The fix in the wetter east and south-east, keep valleys and gutters clear and check them after heavy rain, not just once a year. See how often to clean gutters, or have us look at your guttering.
Hot days and cold nights: Viewbank gets the most 35 °C days
Of the eight stations that record temperature, Viewbank gets the most days at 35 °C or hotter (14.0 a year) and has an average January maximum of 28.3 °C. Laverton has the most nights at 2 °C or colder (15.6). The city station at Olympic Park has only 1.5.
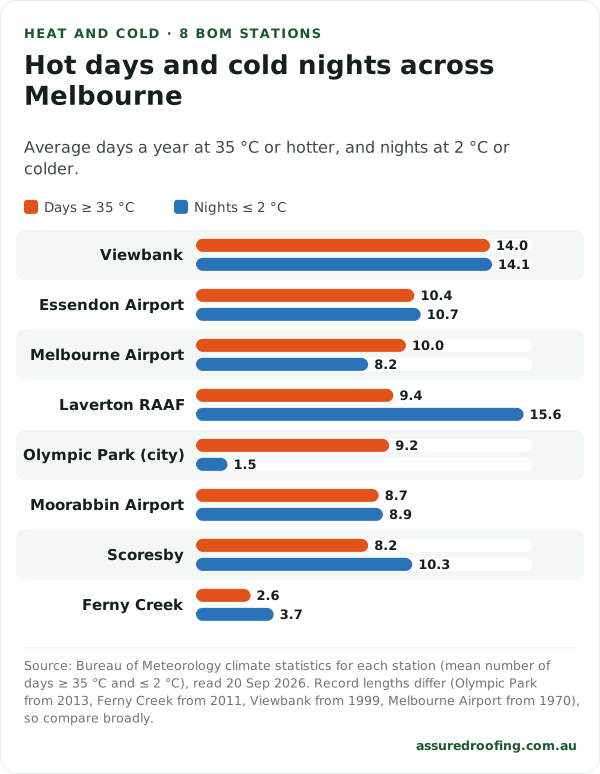
Days a year at 35 °C or hotter and nights at 2 °C or colder at eight BOM stations. The figures are in the table below.
BOM station | Days ≥ 35 °C | Nights ≤ 2 °C | January avg max °C | Record |
|---|---|---|---|---|
Viewbank | 14.0 | 14.1 | 28.3 | 1999 to 2026 |
Essendon Airport | 10.4 | 10.7 | 26.7 | 1939 to 2026 |
Melbourne Airport | 10.0 | 8.2 | 26.7 | 1970 to 2026 |
Laverton RAAF | 9.4 | 15.6 | 25.8 | 1943 to 2026 |
Olympic Park (city) | 9.2 | 1.5 | 26.8 | 2013 to 2026 |
Moorabbin Airport | 8.7 | 8.9 | 26.0 | 1971 to 2026 |
Scoresby | 8.2 | 10.3 | 26.6 | 1965 to 2026 |
Ferny Creek | 2.6 | 3.7 | 24.4 | 2011 to 2026 |
Big swings between hot days and cold nights make a roof expand and contract harder, and that's what cracks old rigid pointing on the ridges. I've written up what ridge capping is and when it needs repointing.
Wind: the airports in the west, north-west and bayside are the windiest
Average 3pm wind speeds run 15.4 to 22.0 km/h across these stations. The open airports at Melbourne Airport, Essendon, Laverton and Moorabbin sit at the top. The highest gusts on record are 154 km/h at Laverton and 147 km/h at Essendon Airport.
BOM station | Avg 3pm wind (km/h) | Highest gust on record (km/h) | Gust record |
|---|---|---|---|
Laverton RAAF | 21.1 | 154 | 1941 to 2025 |
Essendon Airport | 22.0 | 147 | 1939 to 2025 |
Melbourne Airport | 22.0 | 139 | 1970 to 2025 |
Moorabbin Airport | 21.4 | 115 | 1972 to 2025 |
Viewbank | 17.2 | 96 | 2003 to 2025 |
Scoresby | 15.4 | 89 | 2001 to 2025 |
Olympic Park (city) | not published | 85 | 2013 to 2025 |
Ferny Creek | not published | 81 | 2011 to 2025 |
Wind is what lifts loose ridge caps and slips tiles out of line. VICSES warns that loose roof tiles can become flying debris in strong winds.
What your suburb’s weather means for your roof
North-west and west: the driest, windiest and coldest at night
Around Tullamarine, Essendon, Moonee Ponds, Taylors Lakes, Keilor East and Point Cook, rainfall is the lowest in Melbourne (533 to 591 mm), but the gust records are the highest and cold nights are common (8.2 a year at Melbourne Airport, 15.6 at Laverton).
On these roofs the usual problems are wind-lifted ridge caps, slipped tiles and cracked pointing, more than moss. The north-west is our home patch; we're based in St Albans.
Inner north: Brunswick, Preston and Montmorency
The gauges near Brunswick, Preston and Montmorency record 591 mm at Flemington, 657 mm at Preston Reservoir and 735 mm at Eltham. Rain climbs as you go north-east towards the hills.
Inner east: Kew, Hawthorn, Camberwell, Balwyn, Surrey Hills, Toorak and Malvern
All seven are nearest the Hawthorn gauge (661 mm a year). The rain is moderate, but the big old trees and older terracotta roofs around Kew, Hawthorn, Camberwell, Balwyn, Surrey Hills, Toorak and Malvern mean leaf-filled valleys and tired pointing.
Doncaster, Templestowe, Box Hill and Burwood: hotter summers, wetter to the east
Viewbank, the nearest station to Doncaster and Templestowe, gets 14.0 days a year at 35 °C or hotter, the most of any station here, and 14.1 cold nights. Box Hill and Burwood are nearest Mitcham (840 mm a year).
The January 2020 hail hit Templestowe among the worst (AIDR). Heat and hail are the big risks here; see what hail does to a roof.
South-east: the wettest suburbs we cover
The gauges nearest Glen Waverley, Wheelers Hill, Mount Waverley, Clayton, Mulgrave and Rowville record 740 to 854 mm a year. Scoresby averages 114.6 rain days a year, the most of any temperature station here outside the ranges.
Damp roofs grow moss and lichen, and valleys and gutters work hard. On a Glen Waverley Colorbond roof we restored, the old coating had broken down and left bare metal exposed.
Bayside: Brighton, Hampton, Sandringham, Bentleigh and South Melbourne
Cheltenham's gauge, nearest Hampton and Sandringham, records 736 mm a year, and Oakleigh's, nearest Bentleigh, 740 mm. Moorabbin Airport, between them, averages 701 mm. Brighton's nearest gauge in this set is Hawthorn (661 mm), about 8 km away, and South Melbourne is nearest the city station (575 mm).
Moorabbin's average 3pm wind (21.4 km/h) is close to the airports in the west, so wind matters on bayside roofs as well as rain.
Outer east: Ringwood and Bayswater
Ringwood North records 832 mm a year and Croydon 882 mm, near Ringwood and Bayswater. Tall trees and heavy rain make gutters, valleys and moss the main jobs.
Where our work is
Of the 385 repair and restoration jobs we've done since 2021 (as at September 2026), 175 were in the inner east (Hawthorn, Surrey Hills, Balwyn, Box Hill, Burwood, Doncaster and Templestowe), 86 in the north-west and 73 in the inner south. See all the suburbs we cover.
Sources and methodology
Every figure in this guide comes from a published source or from our own work. Here is where each one came from and how we used it.
Where the numbers come from
Bureau of Meteorology, climate statistics: Melbourne Airport (086282), Essendon Airport (086038), Laverton RAAF (087031), Melbourne (Olympic Park) (086338), Viewbank (086068), Scoresby Research Institute (086104), Moorabbin Airport (086077) and Ferny Creek (086266): rainfall, rain days, heavy-rain days, days at 35 °C or hotter, nights at 2 °C or colder, 3pm wind and highest gusts. Checked 20 September 2026.
Bureau of Meteorology, Climate Data Online (monthly rainfall): mean annual rainfall at 12 rainfall stations, including Hawthorn (Scotch College) 086304, Glen Waverley (Golf Course) 086303, Preston Reservoir 086096 and Croydon (Dorset Golf Course) 086234. Checked 20 September 2026.
Bureau of Meteorology, Victorian station list: station coordinates, record length and completeness. Checked 20 September 2026.
VICSES, storms: roof tiles as flying debris in strong winds. Checked 19 September 2026.
Australian Disaster Resilience Knowledge Hub: January 2020 hailstorms and the worst-hit suburbs. Checked 15 July 2026.
How we worked them out
All figures are BOM's published long-term means. We haven't adjusted or combined them. Rainfall for the eight airport and research stations comes from their climate statistics; for the other 12 it's the mean annual total in Climate Data Online's monthly rainfall statistics.
Records differ in length, from 13 years at Olympic Park to more than a century at Flemington, Preston Reservoir and Eltham. Treat side-by-side comparisons as broad.
"Nearest station" is the straight-line distance from each suburb's centre (from our service map) to the station's coordinates in BOM's station list. Ferny Creek is shown as a reference only; it isn't nearest to any suburb we cover.
"Highest gust on record" is BOM's maximum wind gust for the station's gust record. Longer records and open airport sites catch bigger gusts, which is why we lead with average 3pm wind.
The roof effects for each region come from our own work on Melbourne roofs.
Good to know a rain gauge measures one spot. Hills, valleys and tree cover change what lands on your roof, and the rainfall-only stations don't record temperature or wind.
Job figures supplied by Ryan Airey, as at September 2026.
Checked by Ryan Airey on 20 September 2026. Next review: September 2027. How we research, write and check our guides: editorial policy.
Frequently asked questions
What is Melbourne’s average annual rainfall?
About 536 mm a year at Melbourne Airport (BOM, 1970 to 2026) and 575 mm at Olympic Park in the city (2013 to 2026). Across the suburbs it ranges from about 533 mm in the west to 882 mm in the outer east.
Which Melbourne suburbs get the most rain?
The east and south-east. BOM stations record 882 mm a year at Croydon, 854 mm at Scoresby, 851 mm at Springvale and 845 mm at Glen Waverley. Ferny Creek in the Dandenong Ranges records 1,311 mm.
What is the driest part of Melbourne?
The west and north-west. Laverton averages 533 mm a year, Melbourne Airport 536 mm and Essendon Airport 581 mm.
What is the wettest month in Melbourne?
November at Melbourne Airport (62.4 mm on average). In the city's shorter Olympic Park record, April is wettest (66.7 mm), with October and November close behind. August has the most rain days (9.6 at the Airport).
Which part of Melbourne has the hottest summers?
Of the eight BOM stations here that record temperature, Viewbank gets the most days at 35 °C or hotter (14.0 a year, 1999 to 2026), with an average January maximum of 28.3 °C.
Does a wetter suburb mean my roof needs more maintenance?
Usually, for moss, gutters and valleys. More rain days keep tiles and mortar damp and wash more leaf litter into valleys. In the drier, windier west and north-west, the bigger risks are wind-lifted ridge caps and cracked pointing.
:focal(720x150:1000x430))
)
:focal(720x150:1000x430))
)
)